Sign up
Please tick the below box to proceed


I agree (or if I am under 13 my parent or guardian agrees on my behalf) to the terms and conditions of use and that:
- My test statistics may be published on the site leaderboard against my username
- My teacher(s) can review my test scores
- I can receive feedback on my tests from my teacher(s)
Please tick this box to proceed
Already have an account? Sign in
Preview lessons, content and tests
Computer Science & Programming solved. All in one platform.
1. To trial the platform and take tests, please take a few seconds to SIGN UP
and SET UP FREE.
2. Searching for something specific? See our text overview of all tests. Scroll right for levels, and lists.
Join 36000+ teachers and students using TTIO.

Work plans
Work plans: These work plans are often represented in tables. They allow more information to be stored in them than a Gannt chart, as they can include resources and locations. These are usually created in Word Processing software.
Gantt Charts: Gantt Charts essentially show work plans in a more visual and graphical way. Although they may hold less information than a tablebased approach, it is easier to visually track the sequence of events that you have to perform, and check if you are on schedule. They are usually created using Spreadsheet software. Simple formulas can also be added, such as SUM to add up the total hours.
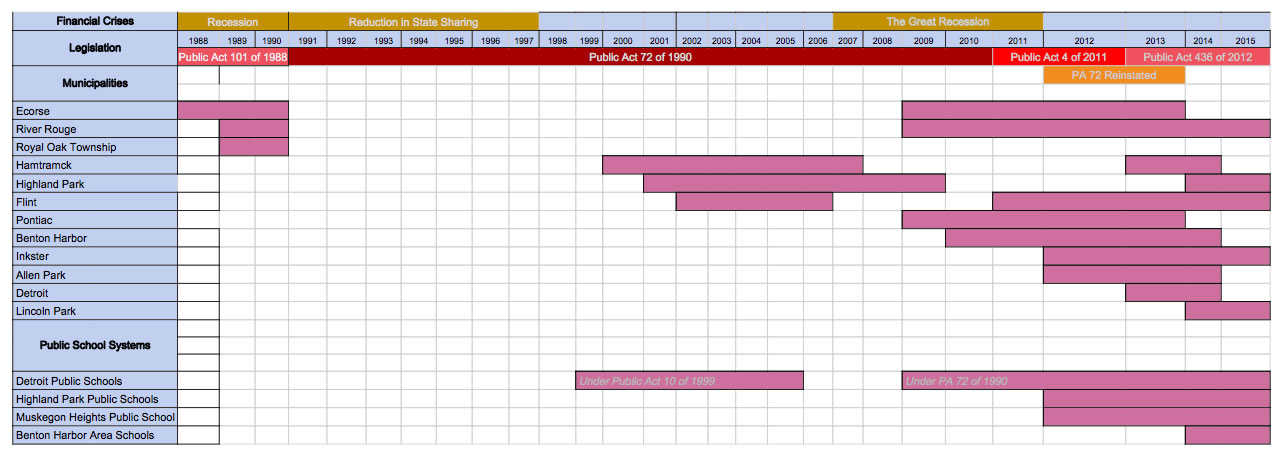
Gantt Chart (below)
Uses of a work plan
Also known as Project plans – is a structured list of all tasks and associated activities needed to complete the project
Purpose
Provide a timescale for the overall project to be completed. Map out against the time all the different aspects of the projects.
Content of a work plan:
Content of work plan
TASKS - show different stages or main sections
ACTIVITIES - a series of things to do in order to complete the task
DURATIONS – amount of time that each task/activity takes
TIMESCALES - how long the overall project will take
MILESTONES - key dates when a section is completed
DEADLINES - a date when something MUST be completed by
RESOURCES – what is needed to do the tasks and activities
CONTINGENCIES – ‘What if’ scenarios, back-up plans such as extra time or alternative ways to do things.
Work flow
This refers to the order that the activities will be completed in but can also be the sequence within the software application between importing assets and exporting the final output.