- 0-Introduction
- 1-Chatbot Variables
- 2-Password IF Statements
- 3-Create Main Menu functions
- 4-Complete Quiz 3 Questions
- 5-Adding Score variable global
- 6-Debug this code
- 7-Introducing While loops Boolean flags
- 8-Introducing Validation password creation
- 9a-For Loop Guess the number
- 9b-For Loop Password Challenge
- 9c-For Loop Times table challenge
- FINAL CHALLENGE
- Skills Consolidation Task 1
- Test 1
- 0-Introduction
- 1-Introducing Lists
- 2-Personality Predictor Lists app
- 3-Players assigned weapons lists
- 3a-Nested List Matrix Snakes and Ladders game
- 3b Nested List Super Extension Complete game
- 4-String Manipulation Username Creator
- 5-StringManipulation Email Creator based on Validated username
- 6-Strip characters from password app
- 7-Create registration feature using lists
- 8-Introducing Dictionaries registration with dicts
- 8a-Course teacher finder program with dicts
- 9a-Football Club app Create and Learn
- 9b-Online Shopping Basket Checkout Program Create and Learn
- Test 1
- 0-Introduction
- 1-Introducing File Handling
- 2-READ from fake facebook file
- 3-SEARCH for username return no of friends
- 4-SEARCH by ID return full record listing
- 5-ADD WRITE a new user to file
- 6-SORT file by USER ID and Last Name
- 7-Bingo game store scores
- 8-Modulo Magic Program
- 9-Create Maths Quiz Program Tutorial
- 9a-How-to-DELETE user record row from file
- 9b-How to EDIT a field in a file
- Test 1
- 00 Intro
- 01 Main Menu Start Screen
- 02 Registration Feature Part1
- 03 Secure Password Creator
- 04 Login Functionality
- 05 MainFilms Menu Members
- 06 Allow Users to View films
- 07 Store Viewed Films by user
- 08 Allow users to like films
- 09 Search by Title
- 10 Search by Rating
- 11 Recommendations based on viewing FinalSolutions
- 00 Overview Start Here
- 01 Connect Create table
- 02 Add records to table
- 03 Fetch Display records
- 04 Update database records
- 05 Delete records
- 06 Search by condition where clause
- 07 Search for key phrase word
- 08 Sorting in SQLite
- 09 Search return selected fields
- 10 Count no rows
- 11 Find Max Value in column
- 12 Calculate Average
- 13 Calculate SUM total
- 14 Login username password sqlite
- 00-Introduction to OOP and Classes
- 01-Setup Game Canvas
- 02-Create a Ball Class
- 03-Setup main animation loop
- 04-Make the ball move up
- 05-Create bouncing ball movement
- 06-Change Starting Direction
- 07-Right left wall collision detection
- 08-Add Pong bat paddle class
- 09-Bat movement
- 10 Bat Ball collision detection
- 11 End Game Feature if ball hits bottom
- 12 Display text game over
~ Simplest way to sort a file in python - teach yourself python
Sorting files in Python - by specific fields.
Challenge -Sort a file in Python by ID number or any other specific field)
Read the task instructions that are included in the comments in the code, and then get started!
You can either edit and code online in repl.it or alternatively, you can simply cut and paste the below into your own python file
Solve the challenge on repl.itCode
""" ==============TASK
Several applications will require you to carry out a Sort.

1. Using the existing code below, adapt it to get the program to sort by USER ID (001 first)
2. Print the results to the screen (as a list) (it doesn't need t be necessarily printed back to the file)
"""

import csv

#1. This code snippet sorts the file by index 2 (last name) using lambda

with open('fakefacebook_write.txt','r',newline="") as f: #open the file in read mode
        reader=csv.reader(f)
        sorted_list=list(reader)#turn the reader iterator into a list
        sorted_list.sort(key=lambda x:x[2]) #use index 02 as the column to sort by, in this case last name
        #print(sorted_list) #this will simply print the sorted list --> Below is a prettier (formatted) print
        print("\n".join(str(row) for row in sorted_list))  # prettier print
File Contents
Filename:fakefacebook_write.txt
ID,firstname, lastname,username,password,email,no_of_likes
001,Ruth,Marvin,marvR,pass123,[email protected],400
002,Carter,Smith,smithC,open123,[email protected],200
003,Joe,Blogs, blogsJ,2bg123,[email protected],99
004,Ruth,Pigachee,pigR,pig123,[email protected],72
Code your solution here
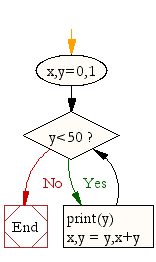
Systems Life Cycle (in a nutshell): Analyse - Design - Create - Test - Evaluate. Designing something or writing out some pseudocode before you actually write code is always a good idea! Get in to the habit of doing so! You can draw your flowchart here and screenshot it.A sample flow chart (design) for this particular challenge could look like:
Each challenge section below provides an online drawing tool where you can dynamically create flowcharts. Screenshot them into your presentation for submission.
Solutions & Answers
Answers /Solutions in the "members area" drive under: "Solve and Learn >>SOLUTIONS"Testing Table
You may want to read a little about Testing first. A teacher may go through some examples with you. Feel free to fill in the test table here, and screenshot it in to your powerpoint. Testing is absolutely essential once you have created a program!| Test No. | Description | Test Data(input) | Expected Outcome | Actual Outcome | Further Action? |
|---|---|---|---|---|---|
| 1 | |||||
| 2 | |||||
| 3 | |||||
| 4 | |||||
| 5 |
Coming soon!